The Kafka Queue feature introduced by KIP-932 as an early access in Kafka version 4.0 which is supported by Strimzi 0.46. In this blog, I’m going to introduce this feature and how you can try it out with your Strimzi managed cluster.
This feature is only supported with KRaft clusters since Zookeeper was removed in the Kafka 4.0 release. It is also based on the new consumer rebalance protocol introduced by KIP-848 that enhances stability, scalability and simplifies client implementations.
The Kafka Queue feature allows you to use Kafka like a traditional message queue and increase parallelism of message processing beyond the number of partitions. It provides queue-like semantics through a new consumer group called shared group. This new type of group gives more fine-grained control on message acknowledgement and retries.
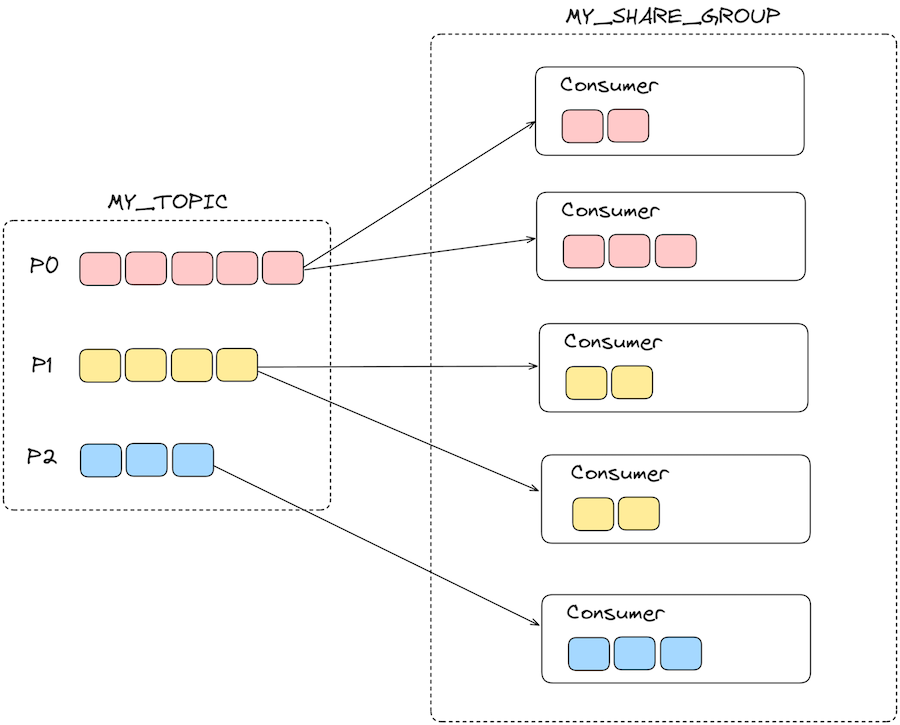
The key difference between share group and regular consumer group is how partitions get assigned to consumer members. With regular consumer groups, each partition is exclusively assigned to a single member of the consumer group, therefore users typically have as many consumer members as the number of partitions to maximise the parallelism in message processing. However, share groups balance partitions between all members of a share group, allowing multiple consumer members to fetch from the same partition. So users can have more consumers than the number of partitions, further increasing the parallelism.
Partition Assignments
Partitions are assigned to members of a shared group in round robin fashion while trying to maintain even balance in the assignment. Assignments in share groups are dynamic, when a consumer leaves or joins or when a partition is added, all the partitions are rebalanced across the members. As long as a consumer member continues to call the poll(), it stays in the group and continues to receive records from its assigned partitions. Similar to regular consumer groups, in the background, members of a shared group also send periodic heartbeats to the brokers. If a member doesn’t send a heartbeat request within the group.share.session.timeout.ms, it will be considered inactive and partitions will be reassigned to other members. If it is sending heartbeat requests to the broker, but it does not call the poll() within max.poll.interval.ms, then it will leave the group and the partitions will be reassigned as well.
Fetch mechanism
When a consumer in a share group fetches records, it acquires the records with a time-limited acquisition lock. While a record is acquired, it’s not available for other consumers. The lock is automatically released once the lock duration has elapsed and the record becomes available again for another delivery attempt. This makes sure delivery progress even when a consumer fails to process the record. The lock duration can be configured with the broker configuration, group.share.record.lock.duration.ms which is set to 30s by default.
The number of records acquired for a partition by consumers in a shared group is also limited. Once this limit is reached, fetching of records from the shared group temporarily pauses until the number of acquired records reduces. The limit can be configured with the broker configuration, group.share.partition.max.record.locks which is set to 200 by default.
Records transition through different states when being fetched depending on the actions taken by consumers of a shared group. Consumer can:
- Acknowledge once the record is successfully processed
- Release the record, to make it available for another delivery attempt
- Reject the record, if it is unprocessable and the record should not be available for another delivery attempt
If none of the above is done by the consumer e.g. the consumer is still in the middle of processing the record and is taking a long time, the lock will be automatically released once the lock duration is elapsed.
Delivery State
Delivery count for each record is tracked and gets incremented every time a consumer acquires the record. There is a limit on the number of times records can be retried to avoid getting stuck trying to deliver unprocessable records indefinitely. This limit also can be reconfigured with broker configuration, group.share.delivery.count.limit with default value of 5.
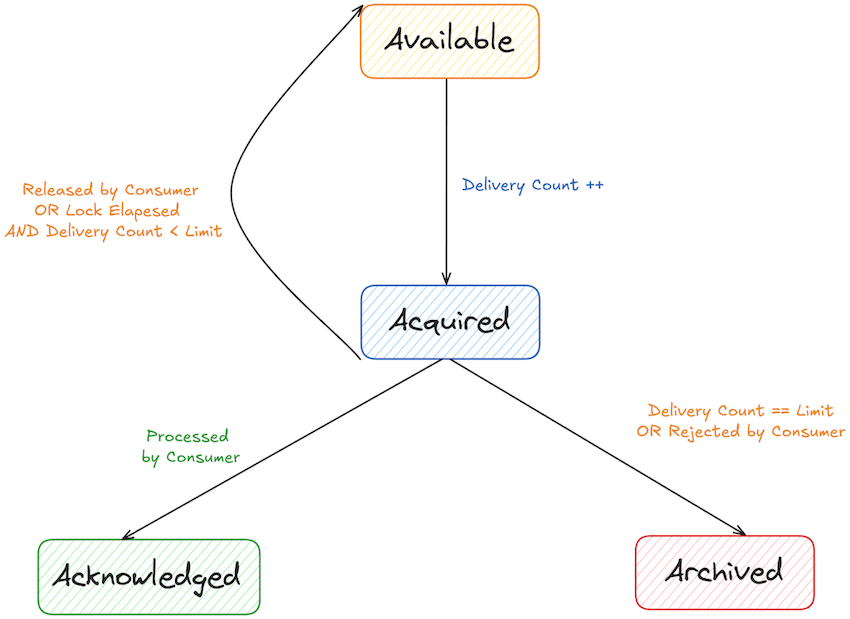
The delivery count determines which state the record should transition into later on. If the consumer releases the record or the lock duration has lapsed, it will go back into Available state as long as the delivery count has not reached the limit. The record will go into Acknowledged state if it has been successfully processed by the consumer. If the consumer rejects the record or its delivery count has reached the limit, the record will go into Archived state.
In the traditional message queue, once a record is fetched by a consumer, it is no longer in the queue. You can think of Archived state, as the records that are taken off the queue and no longer available.
Share Group State
The share group persists state management for subscribed partitions, by storing it in an internal topic called, __share_group_state. This topic stores state of share groups, for example, the partitions they are subscribed to and the state of those partitions such as their fetched start offset (SPSO) and the end offset (SPEO) as well as the delivery state and delivery count of the records on the partitions.
We can take a look at how this information is stored in the __share_group_state topic by using the console consumer tool:
./bin/kafka-console-consumer.sh --bootstrap-server localhost:9092 --topic __shared_group_state | jq .
The following is an example of the records produced to this topic which is in JSON format:
{
  "key": {
    "version": 0,
    "data": {
      "groupId": "my-share-group",
      "topicId": "9fagJTJNTaa-FwT6umvvCA",
      "partition": 0
    }
  },
  "value": {
    "version": 0,
    "data": {
      "snapshotEpoch": 2,
      "stateEpoch": 0,
      "leaderEpoch": 0,
      "startOffset": 560,
      "stateBatches": [
        {
          "firstOffset": 560,
          "lastOffset": 560,
          "deliveryState": 0,
          "deliveryCount": 1
        },
        {
          "firstOffset": 561,
          "lastOffset": 564,
          "deliveryState": 2,
          "deliveryCount": 1
        },
        {
          "firstOffset": 565,
          "lastOffset": 565,
          "deliveryState": 4,
          "deliveryCount": 1
        },
        {
          "firstOffset": 566,
          "lastOffset": 569,
          "deliveryState": 2,
          "deliveryCount": 1
        },
        {
          "firstOffset": 570,
          "lastOffset": 570,
          "deliveryState": 0,
          "deliveryCount": 1
        },
      ]
    }
  }
}
Subscribed partitions’ states are stored in batches as records get consumed and acknowledged in batches too. In the example above, you can see the batch of states, one of which is for offsets between 561 and 564. These offsets have the same delivery state and count therefore share the same state. In comparison, the offset 560 and 565 have different delivery states therefore listed in individual states.
Map of the states and enums:
| Enum | State |
|---|---|
| 0 | Available |
| 2 | Acknowledged |
| 4 | Archived |
Let’s take a look at the following example of a partition that a share group is subscribed to, which is called Share Partition:
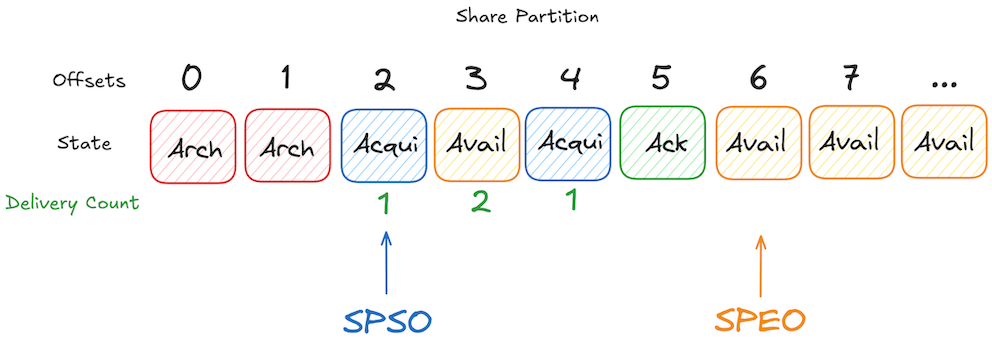
In this example, offset 2 is the start offset that a share group is consuming from the partition and offset 2 and 4 are currently acquired by a consumer of the group for the first time, therefore delivery count is 1. However, the record at offset 3 is in Available state with delivery count of 2, which means a consumer of the group has attempted to deliver this record twice. This record will be retried until the maximum delivery count is reached. The record at offset 5 has been processed successfully and acknowledged and the record at offset 6 is the next available record to be acquired by a consumer of the share group, therefore it is the end offset for this share partition.
Comparing share and consumer groups
I have set up a single node cluster on my machine using Strimzi’s Quickstart and created a topic called kafka-queue with 2 partitions.
I also added the following 2 configurations to my Kafka CR to enable this feature, as it is not enabled by default since it is not production ready yet:
group.coordinator.rebalance.protocols: classic,consumer,share
unstable.api.versions.enable: true
Using the Kafka command line tools, I will produce some records on the topic and consume those records using both consumer and share groups and show how they behave differently.
In this example, I will start with 3 share consumers, all joining the same share group called “share-group” and then 3 regular consumers, also all joining the same consumer group, “consumer-group”. I will run the following command in different terminal windows with different pod names, e.g. kafka-share-consumer-0, kafka-share-consumer-1, kafka-share-consumer-2:
$kubectl -n kafka run kafka-share-consumer-0 -ti --image=quay.io/strimzi/kafka:0.46.0-kafka-4.0.0 --rm=true --restart=Never -- bin/kafka-console-share-consumer.sh --bootstrap-server my-cluster-kafka-bootstrap:9092 --topic kafka-queue --group share-group --property print.offset=true --property print.partition=true
I will do the same for the regular consumers with pod names, kafka-consumer-0, kafka-consumer-1 and kafka-consumer-3:
$kubectl -n kafka run kafka-consumer-0 -ti --image=quay.io/strimzi/kafka:0.46.0-kafka-4.0.0 --rm=true --restart=Never -- bin/kafka-console-consumer.sh --bootstrap-server my-cluster-kafka-bootstrap:9092 --topic kafka-queue --group consumer-group --consumer-property group.protocol=consumer --property print.offset=true --property print.partition=true
This results in the following output:
$kubectl get po -n kafka
NAME                                          READY   STATUS    RESTARTS   AGE
kafka-consumer-0                              1/1     Running   0          2m24s
kafka-consumer-1                              1/1     Running   0          2m28s
kafka-consumer-2                              1/1     Running   0          2m34s
kafka-share-consumer-0                        1/1     Running   0          2m9s
kafka-share-consumer-1                        1/1     Running   0          2m
kafka-share-consumer-2                        1/1     Running   0          110s
my-cluster-dual-role-0                        1/1     Running   0          7m44s
my-cluster-entity-operator-78d5b9dfd9-5ktxt   2/2     Running   0          10m
strimzi-cluster-operator-5dd46b9985-dp2wt     1/1     Running   0          10m
The following screenshot of the split screen shows that I am sending records to the topic with 2 partitions (in left bottom terminal) and the other terminal windows are where the 3 share consumers are running printing the records with their partition number and offset.
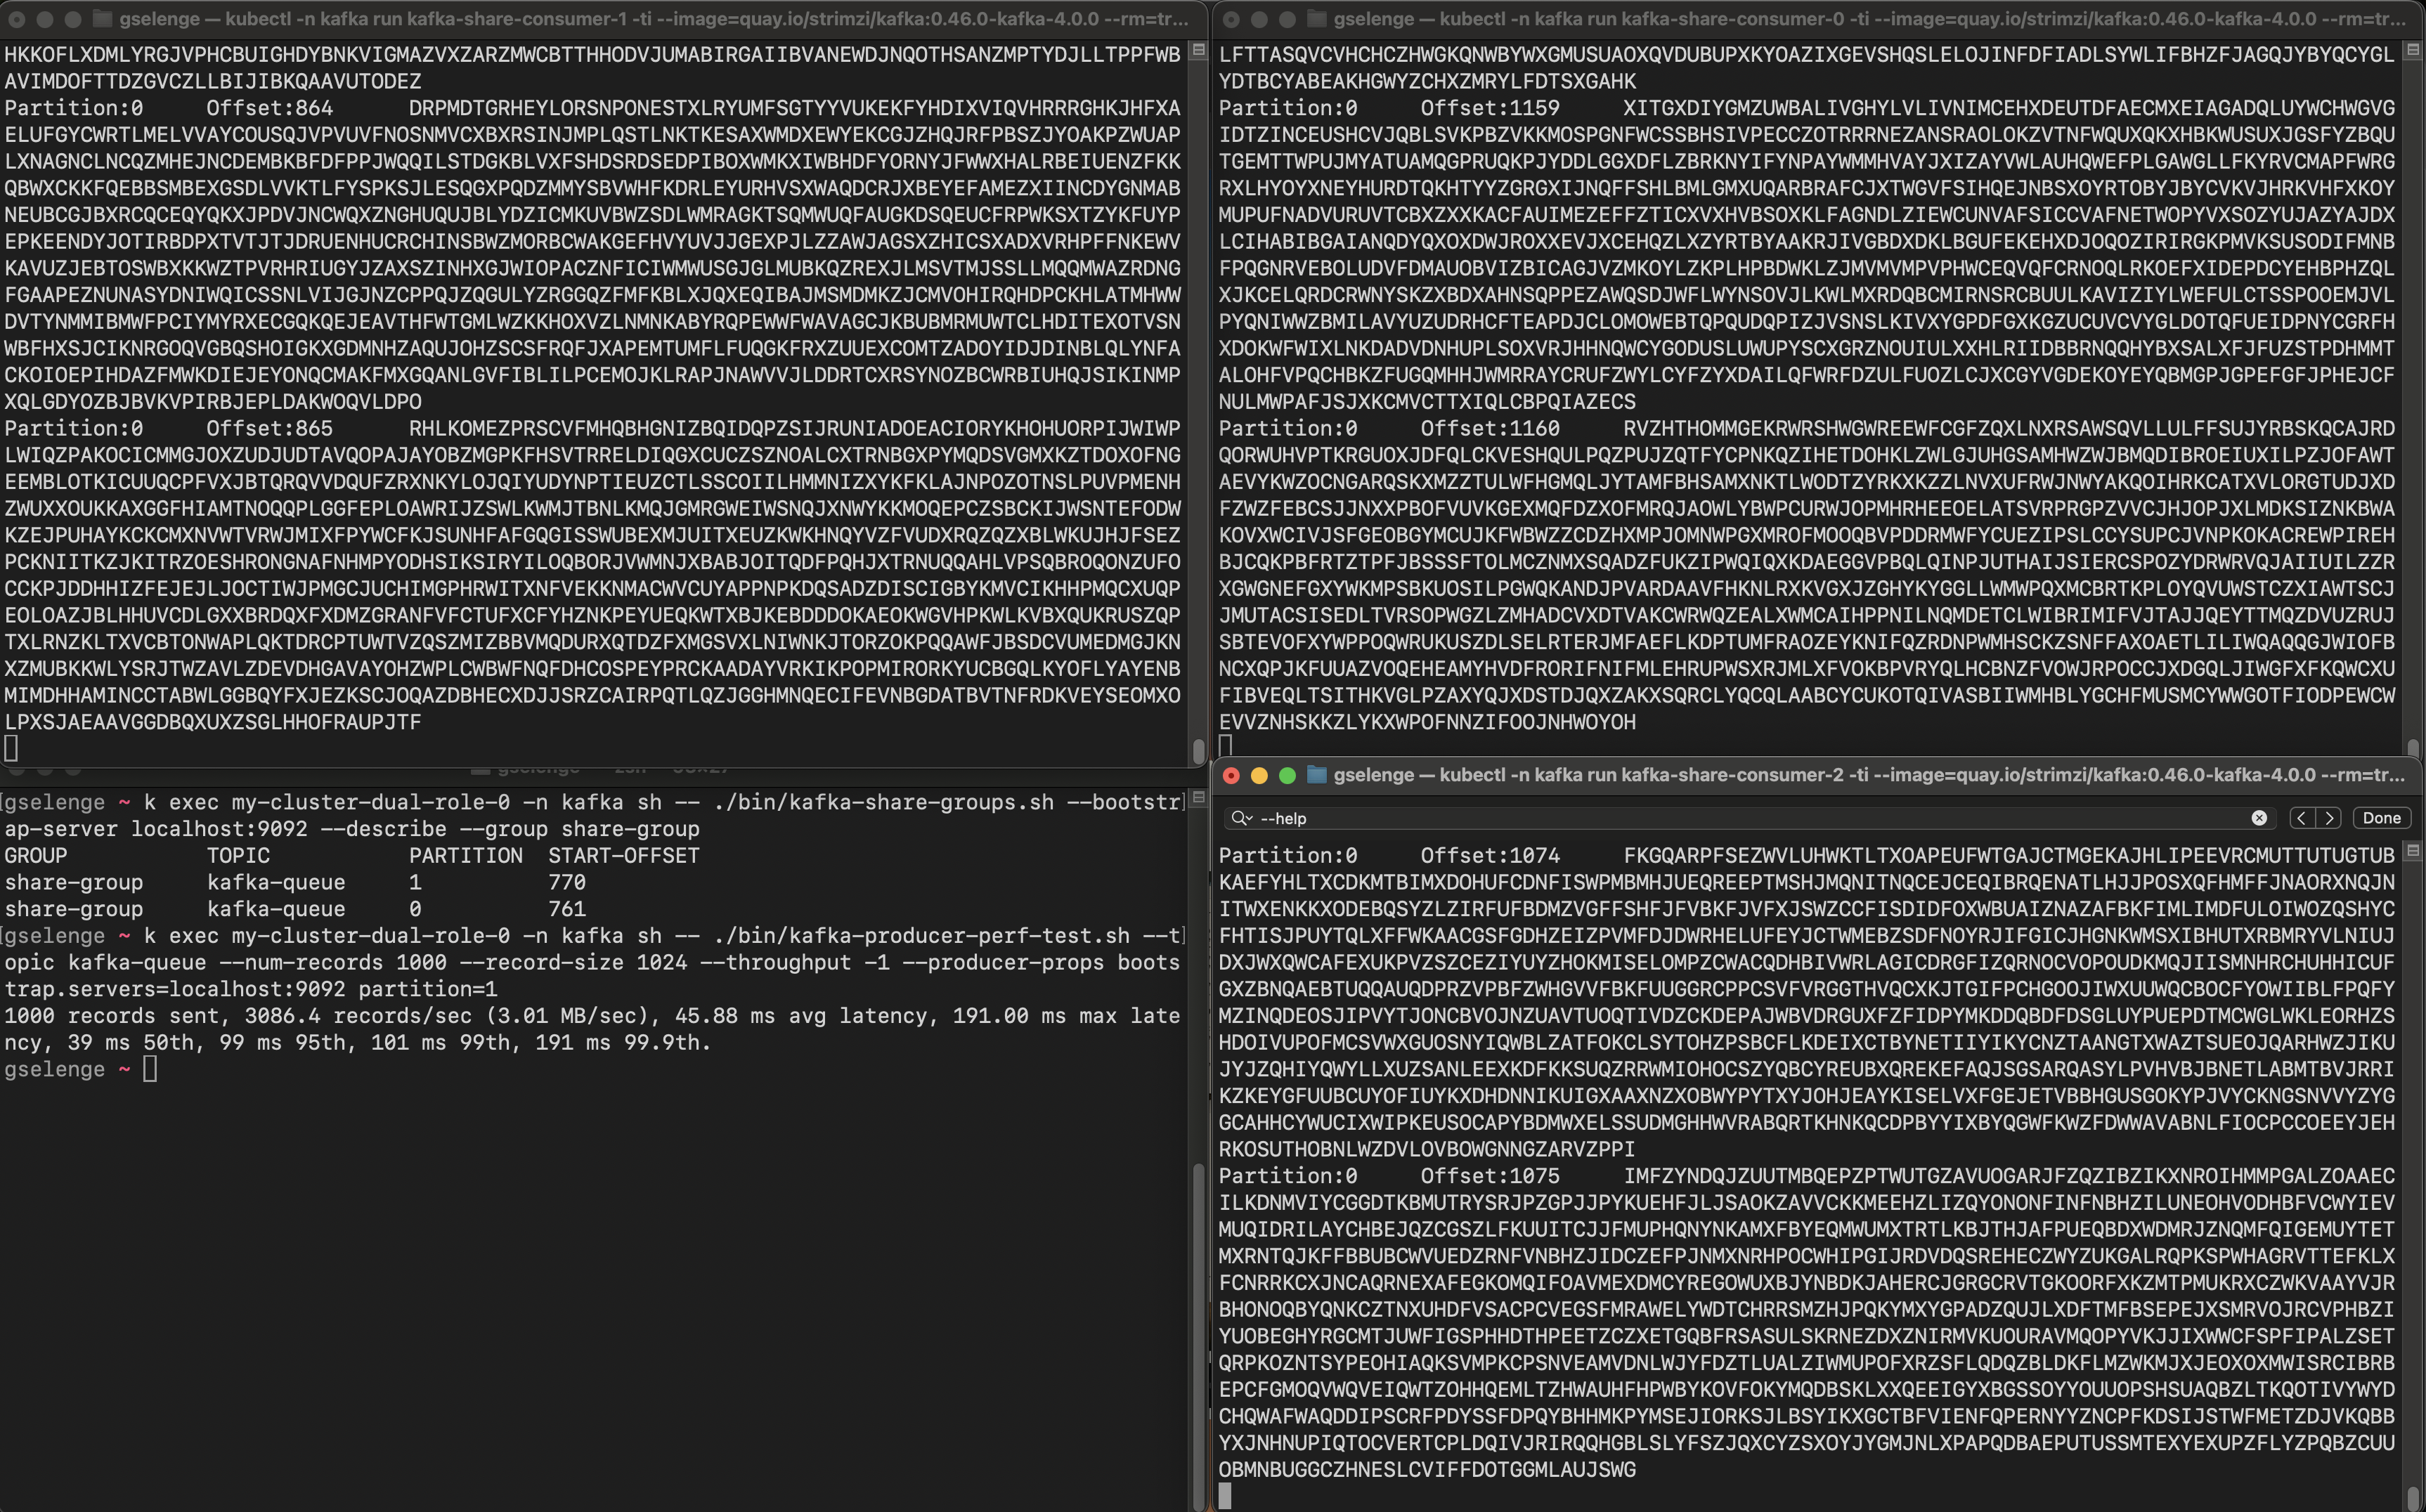
As you can see, all the consumers are assigned to the same partitions and are fetching the records in parallel. Let’s describe the share group using the kafka-share-groups.sh console tool:
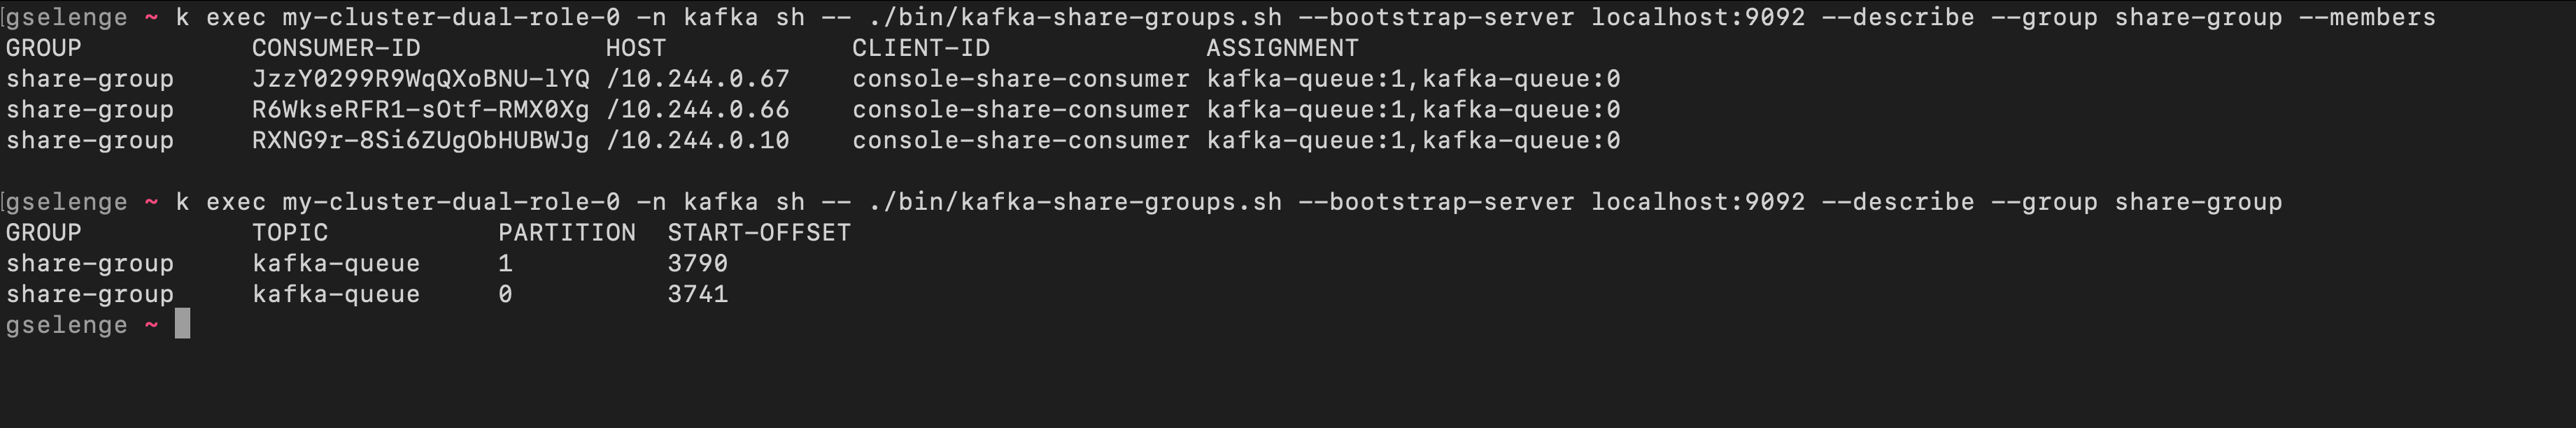
There are 3 members in this share group and when describing the group without the –-members flag, the share partitions with their start offset is are listed.
Now let’s look at the regular consumer group (note that I am using the new consumer group protocol, not classic).
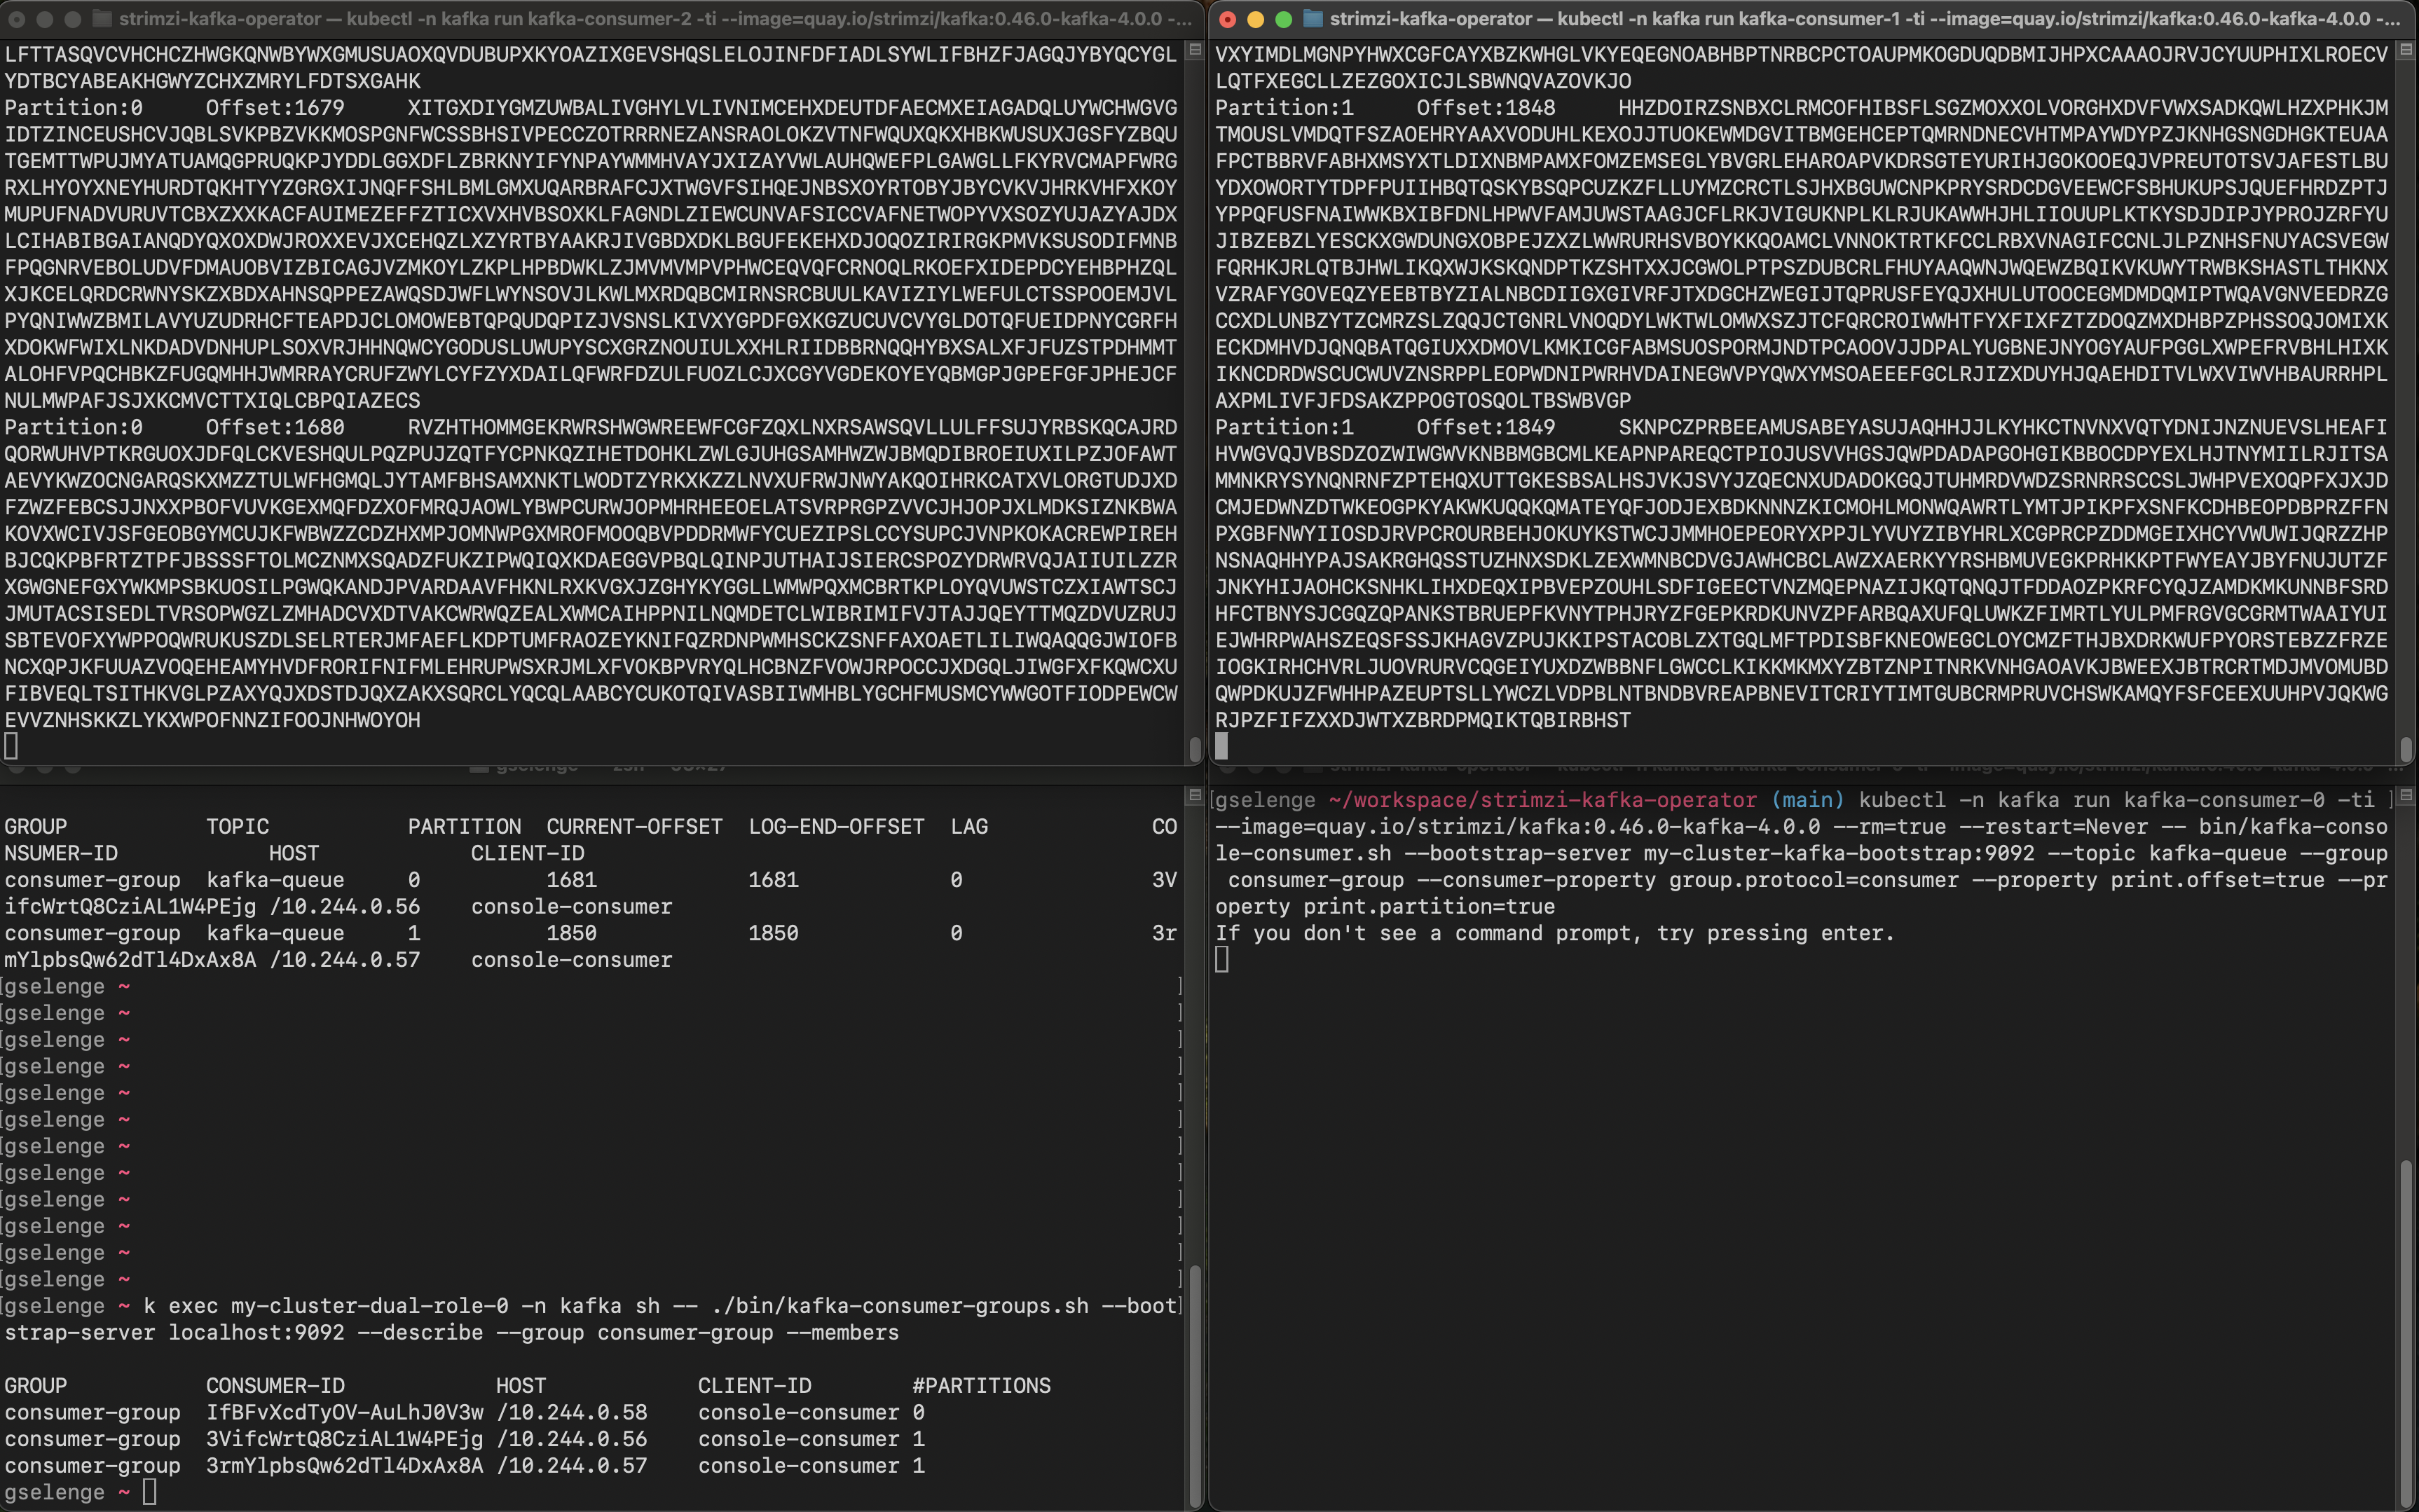
Only kafka-consumer-2 and kafka-consumer-1 are actively fetching from one partition each but kafka-consumer-0 is idle, not fetching records. Let’s describe this consumer group:
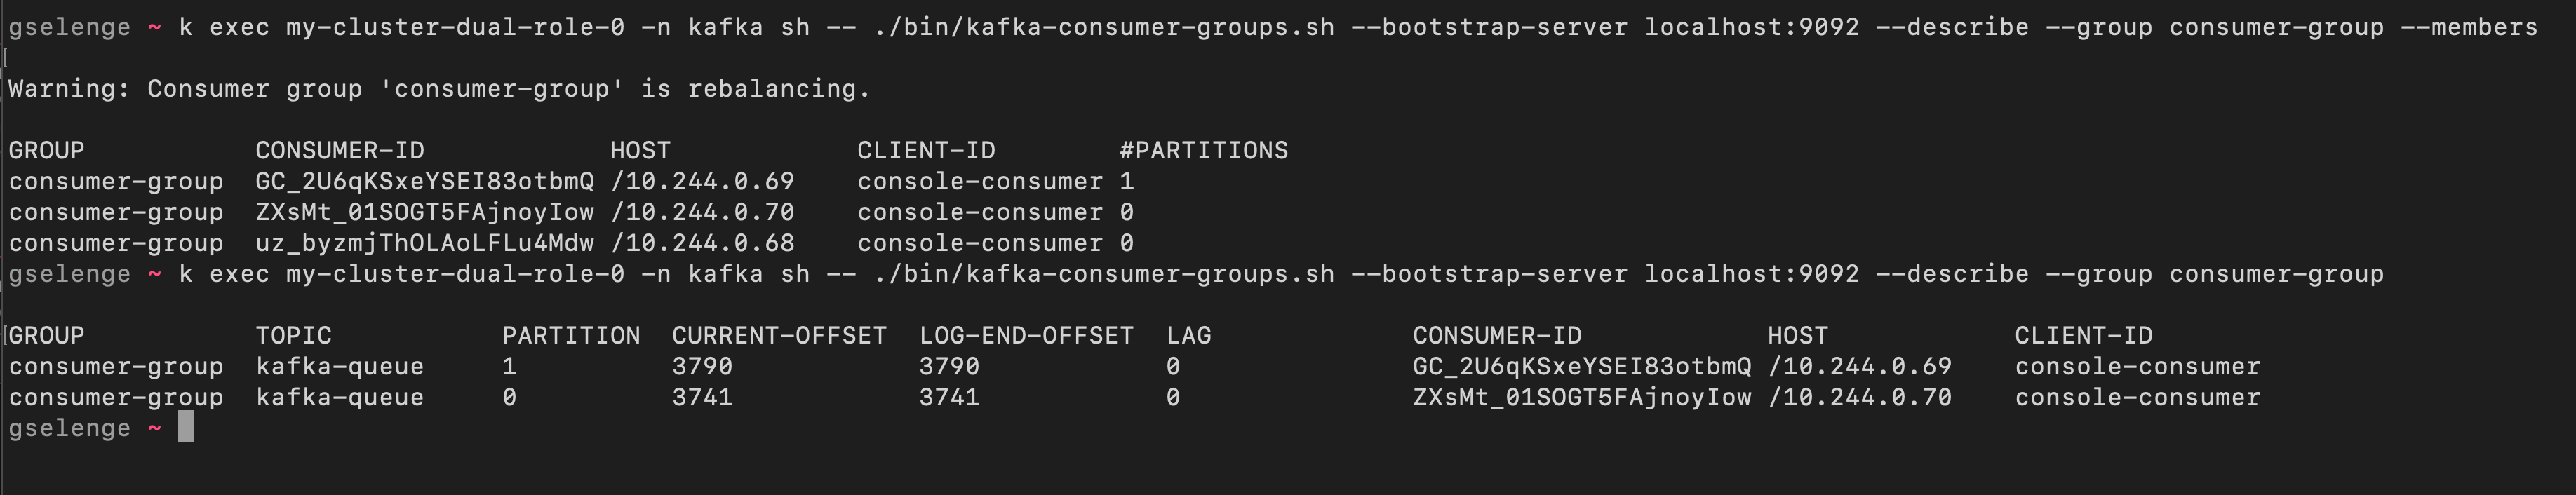
There are 3 members in this group, but only 2 of them are assigned to a partition each exclusively as the topic has only 2 partitions.
KafkaShareConsumer API
Let’s look at the new Java API added for share group consumers. It looks very similar to KafkaConsumer API which makes it easier to use the new API if you are already familiar with it. With the Java API, users can do more fine grained acknowledgements of the records that are consumed and processed. There are 2 different mechanisms to acknowledge records:
Acknowledging records in batches
When acknowledging a batch of records, the implicit acknowledgment is used by calling the poll(). When fetching another batch of records by calling poll(), the batch of records delivered in the previous poll are marked as successfully processed and acknowledged. This is the simplest and the most efficient way to acknowledge records. In the following example, I’ve created a simple share consumer client that implicitly acknowledges batches of records:
Acknowledging individual records
This allows users to acknowledge an individual record depending on the outcome of the processing of the record. Each record is acknowledged using a call to acknowledge() which takes different types of acknowledgement as an argument: ACCEPT, RELEASE and REJECT.
This aligns with the actions that can be taken by share group consumers mentioned previously.
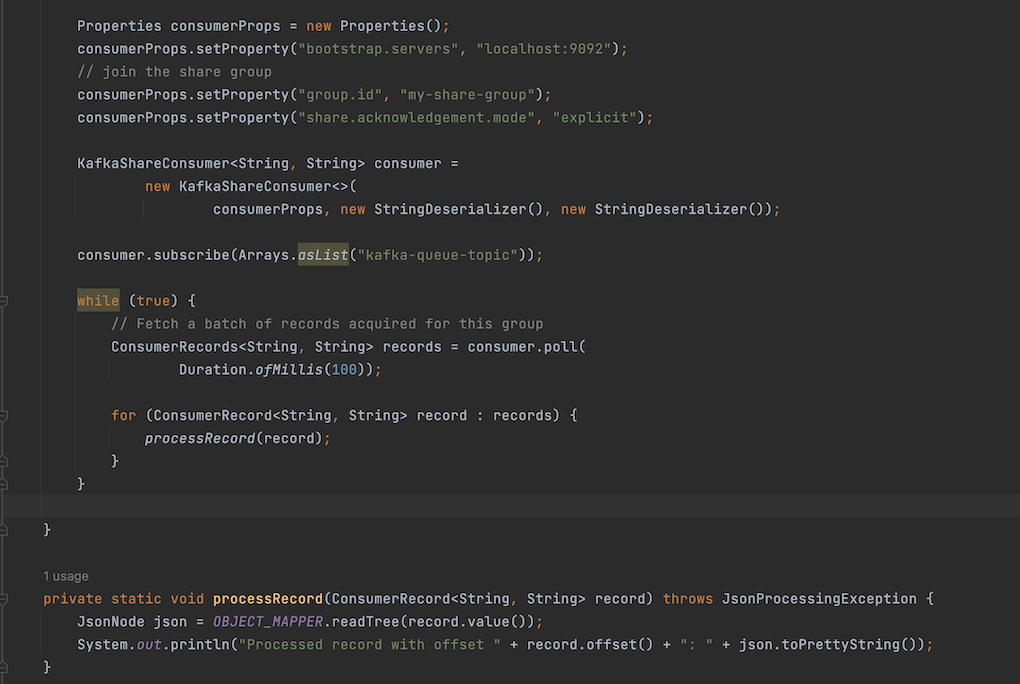
In the next example, I have used the new consumer configuration added for this feature, share.acknowledgement.mode and set it to “explicit”. This configuration is set to “implicit” by default, which is why I didn’t need to set this configuration for the previous example.
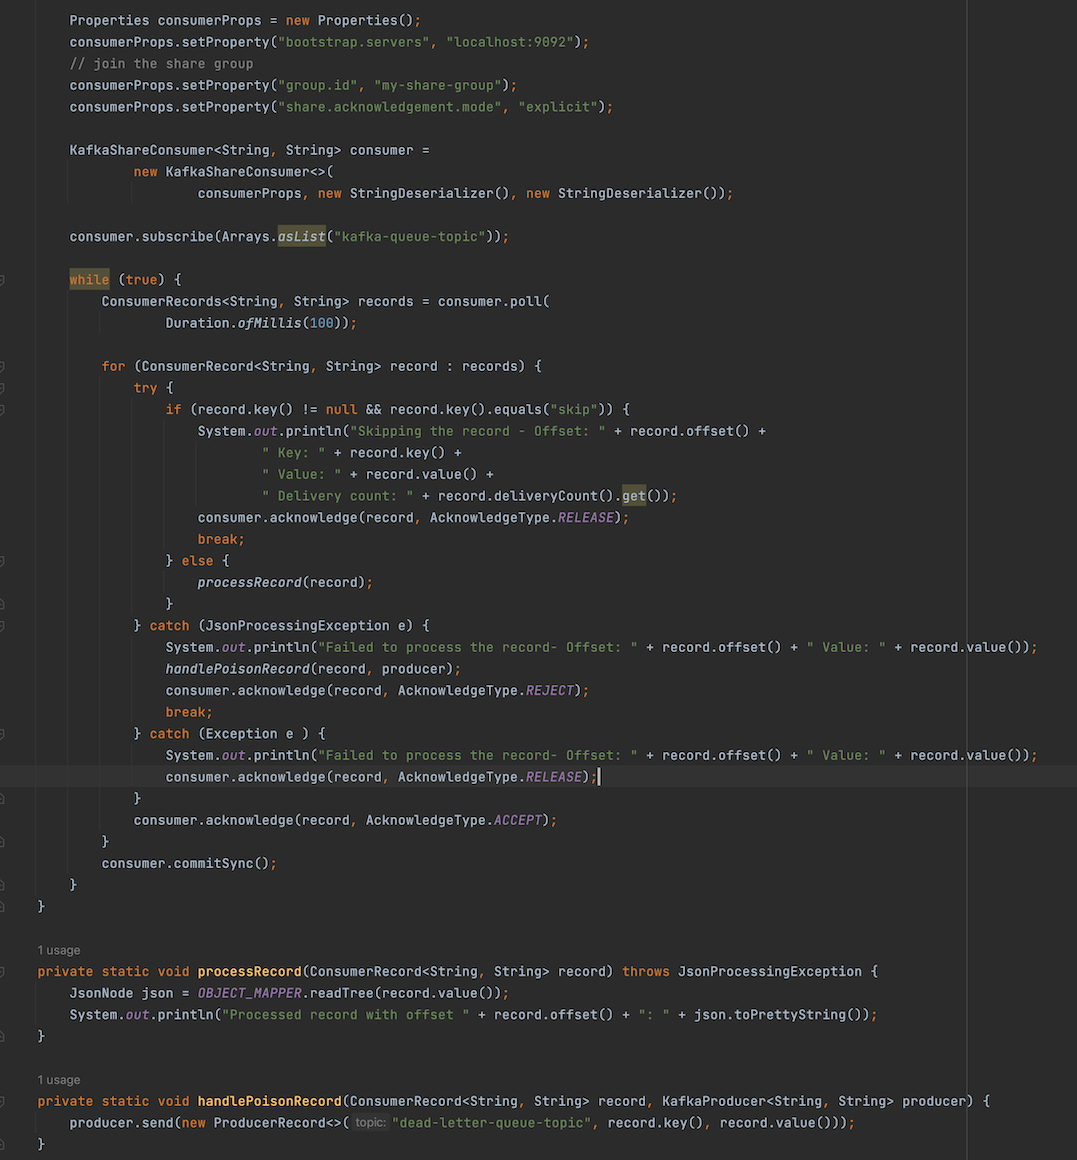
In this example, the consumer will release the record if its key is set to “skip”, just to demonstrate the retry of delivery attempts. This record will be fetched again in the next call to poll() and eventually will hit the maximum delivery attempts and transition into Archived state because the client never processes it. Once archived, this record will no longer be available for another delivery.
Also when a record value cannot be mapped to a valid JSON object, the processing method throws an JsonProcessingException and the client handles it as a poison message. The Kafka Queue feature currently doesn’t support dead letter queue but it will potentially be added in the future. Right now, users have to implement this themselves, similar to this example. Once a poison message record is sent to the dead letter queue topic, the consumer client will reject it so that it gets archived immediately.
If the client encountered an error not caused by the JSON mapping, it releases the record for another attempt because it could be a transient failure.
When no exception occurred during the processing, the consumer client accepts the record. Once all the records in the batch are processed and acknowledged individually, these states are stored locally in the consumer. Then the client has to call commitSync() or commitAsync() to commit the state to the internal topic, __shared_group_state. If any of the records in the batch hits an error or skips the processing, the client commits the state at that point. The records in the batch that were not processed or acknowledged yet, will be presented to the consumer client again as part of the same acquisition, therefore their delivery count will not be incremented.
Inspecting __share_group_state topic
Let’s now take a look at the outcome out of this client:
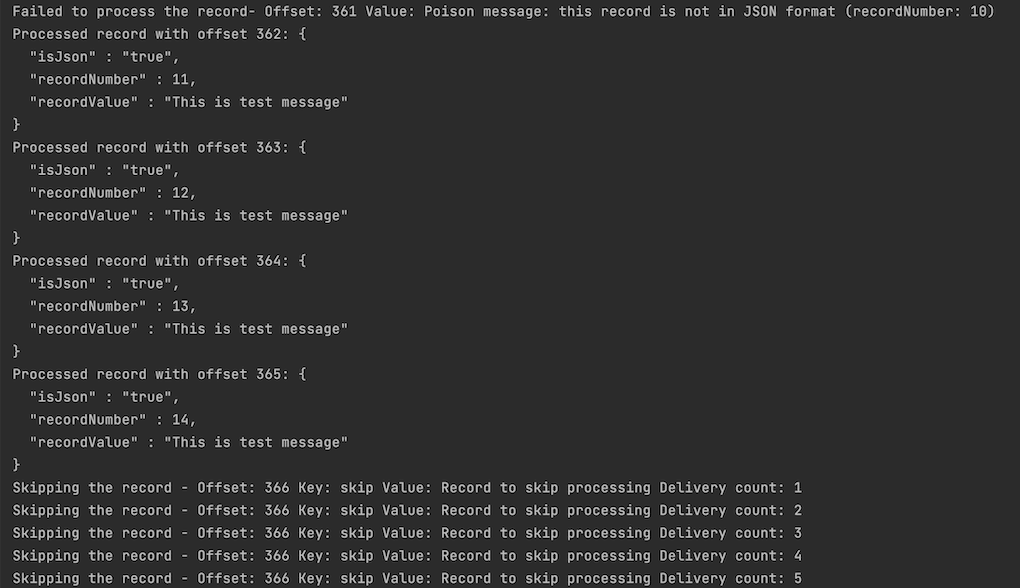
The record at offset 361 was rejected because it hit an error mapping the record value into JSON therefore is considered a poison message. The records at offset 362, 363, 364 and 365 were successfully processed and therefore accepted. The record at offset 366 was however skipped from processing so it was retried 5 times before moving onto the next record.
Let’s now inspect the state of these records from the internal topic, __share_group_state:
$kubectl -n kafka run consumer -ti --image=quay.io/strimzi/kafka:0.46.0-kafka-4.0.0 --rm=true --restart=Never -- bin/kafka-console-consumer.sh --bootstrap-server my-cluster-kafka-bootstrap:9092 --topic __shared_group_state | jq .

{
  "key": {
    "version": 1,
    "data": {
      "groupId": "my-share-group",
      "topicId": "9fagJTJNTaa-FwT6umvvCA",
      "partition": 0
    }
  },
  "value": {
    "version": 0,
    "data": {
      "snapshotEpoch": 1,
      "leaderEpoch": 0,
      "startOffset": 361,
      "stateBatches": [
        {
          "firstOffset": 361,
          "lastOffset": 361,
          "deliveryState": 4,
          "deliveryCount": 1
        }
      ]
    }
  }
}
The offset 361 that had a bad record was Archived (enum 4) state after the first delivery attempt, therefore was not retried again.
{
  "key": {
    "version": 1,
    "data": {
      "groupId": "my-share-group",
      "topicId": "9fagJTJNTaa-FwT6umvvCA",
      "partition": 0
    }
  },
  "value": {
    "version": 0,
    "data": {
      "snapshotEpoch": 1,
      "leaderEpoch": 0,
      "startOffset": 364,
      "stateBatches": [
        {
          "firstOffset": 364,
          "lastOffset": 364,
          "deliveryState": 2,
          "deliveryCount": 1
        }
      ]
    }
  }
}
{
  "key": {
    "version": 1,
    "data": {
      "groupId": "my-share-group",
      "topicId": "9fagJTJNTaa-FwT6umvvCA",
      "partition": 0
    }
  },
  "value": {
    "version": 0,
    "data": {
      "snapshotEpoch": 1,
      "leaderEpoch": 0,
      "startOffset": 365,
      "stateBatches": [
        {
          "firstOffset": 365,
          "lastOffset": 365,
          "deliveryState": 2,
          "deliveryCount": 1
        }
      ]
    }
  }
}
The records at offset 364 and 365 were in Acknowledged (enum 2) after the first delivery attempt, as they were processed and acknowledged successfully by the consumer. (The offset 362 and 363 had the same state, just not included in the output)
{
  "key": {
    "version": 1,
    "data": {
      "groupId": "my-share-group",
      "topicId": "9fagJTJNTaa-FwT6umvvCA",
      "partition": 0
    }
  },
  "value": {
    "version": 0,
    "data": {
      "snapshotEpoch": 1,
      "leaderEpoch": 0,
      "startOffset": 366,
      "stateBatches": [
        {
          "firstOffset": 366,
          "lastOffset": 366,
          "deliveryState": 0,
          "deliveryCount": 1
        }
      ]
    }
  }
}
The record at offset 366 was in Available (enum 0) after the first delivery attempt. This is the record the consumer skipped from processing and simply released. However in the next screenshot, we see that delivery attempts have increased.
{
  "key": {
    "version": 1,
    "data": {
      "groupId": "my-share-group",
      "topicId": "9fagJTJNTaa-FwT6umvvCA",
      "partition": 0
    }
  },
  "value": {
    "version": 0,
    "data": {
      "snapshotEpoch": 1,
      "leaderEpoch": 0,
      "startOffset": 366,
      "stateBatches": [
        {
          "firstOffset": 366,
          "lastOffset": 366,
          "deliveryState": 0,
          "deliveryCount": 4
        }
      ]
    }
  }
}
{
  "key": {
    "version": 1,
    "data": {
      "groupId": "my-share-group",
      "topicId": "9fagJTJNTaa-FwT6umvvCA",
      "partition": 0
    }
  },
  "value": {
    "version": 0,
    "data": {
      "snapshotEpoch": 1,
      "leaderEpoch": 0,
      "startOffset": 366,
      "stateBatches": [
        {
          "firstOffset": 366,
          "lastOffset": 366,
          "deliveryState": 4,
          "deliveryCount": 5
        }
      ]
    }
  }
}
After 4 attempts of delivery, the record was still in Available (enum 0) state but after the 5th attempt, it went into Archived (enum 4) state, which is why it was not retried again.
Broker and share configurations
Summary of the configurations mentioned in this blog:
| Configuration | Type | Default | Description |
|---|---|---|---|
| group.coordinator.rebalance.protocols | Broker | classic,consumer | It should be set to “classic,consumer,share” to enable share group. |
| unstable.api.versions.enable | Broker | false | It should be set to true, in order to use this feature until it is production ready . |
| group.share.record.lock.duration.ms | Broker | 30s | The record acquisition lock duration in milliseconds for share groups. |
| group.share.partition.max.record.locks | Broker | 200 | Share group record lock limit per share-partition. |
| group.share.delivery.count.limit | Broker | 5 | The maximum number of delivery attempts for a record delivered to a share group. |
| group.share.session.timeout.ms | Broker | 45000 | The timeout to detect client failures when using the share group protocol. |
| max.poll.interval.ms | Consumer | 300000 | The maximum delay between invocations of poll() when using consumer group management. |
| share.acknowledgement.mode | Consumer | implicit | Controls the acknowledgement mode for a share consumer. If set to implicit, must not use acknowledge(). Instead, delivery is acknowledged in the next poll call. If set to explicit, must use acknowledge() to acknowledge delivery of records. |
Share this:
![]()
![]()
![]()
![]()
![]()